Canadian macro.
Until it's obvious.
Seeing clearly comes from knowing what to ignore.
Sibley Creek is an independent macroeconomic research and advisory firm.
How we work
Think of it as economic analysis meets investigative journalism. First we dig through the data. Then we get on the phone and talk to the people on the ground.
Founded by Jay Zhao-Murray, former Canada economics data editor at Bloomberg.
Live tracker
Our reading of the Canadian economy, every day.
Eight sections — output, inflation, labour, monetary, fiscal, housing, trade, markets — each charted and annotated. The numbers and our take, refreshed as the data lands.
See the dashboard →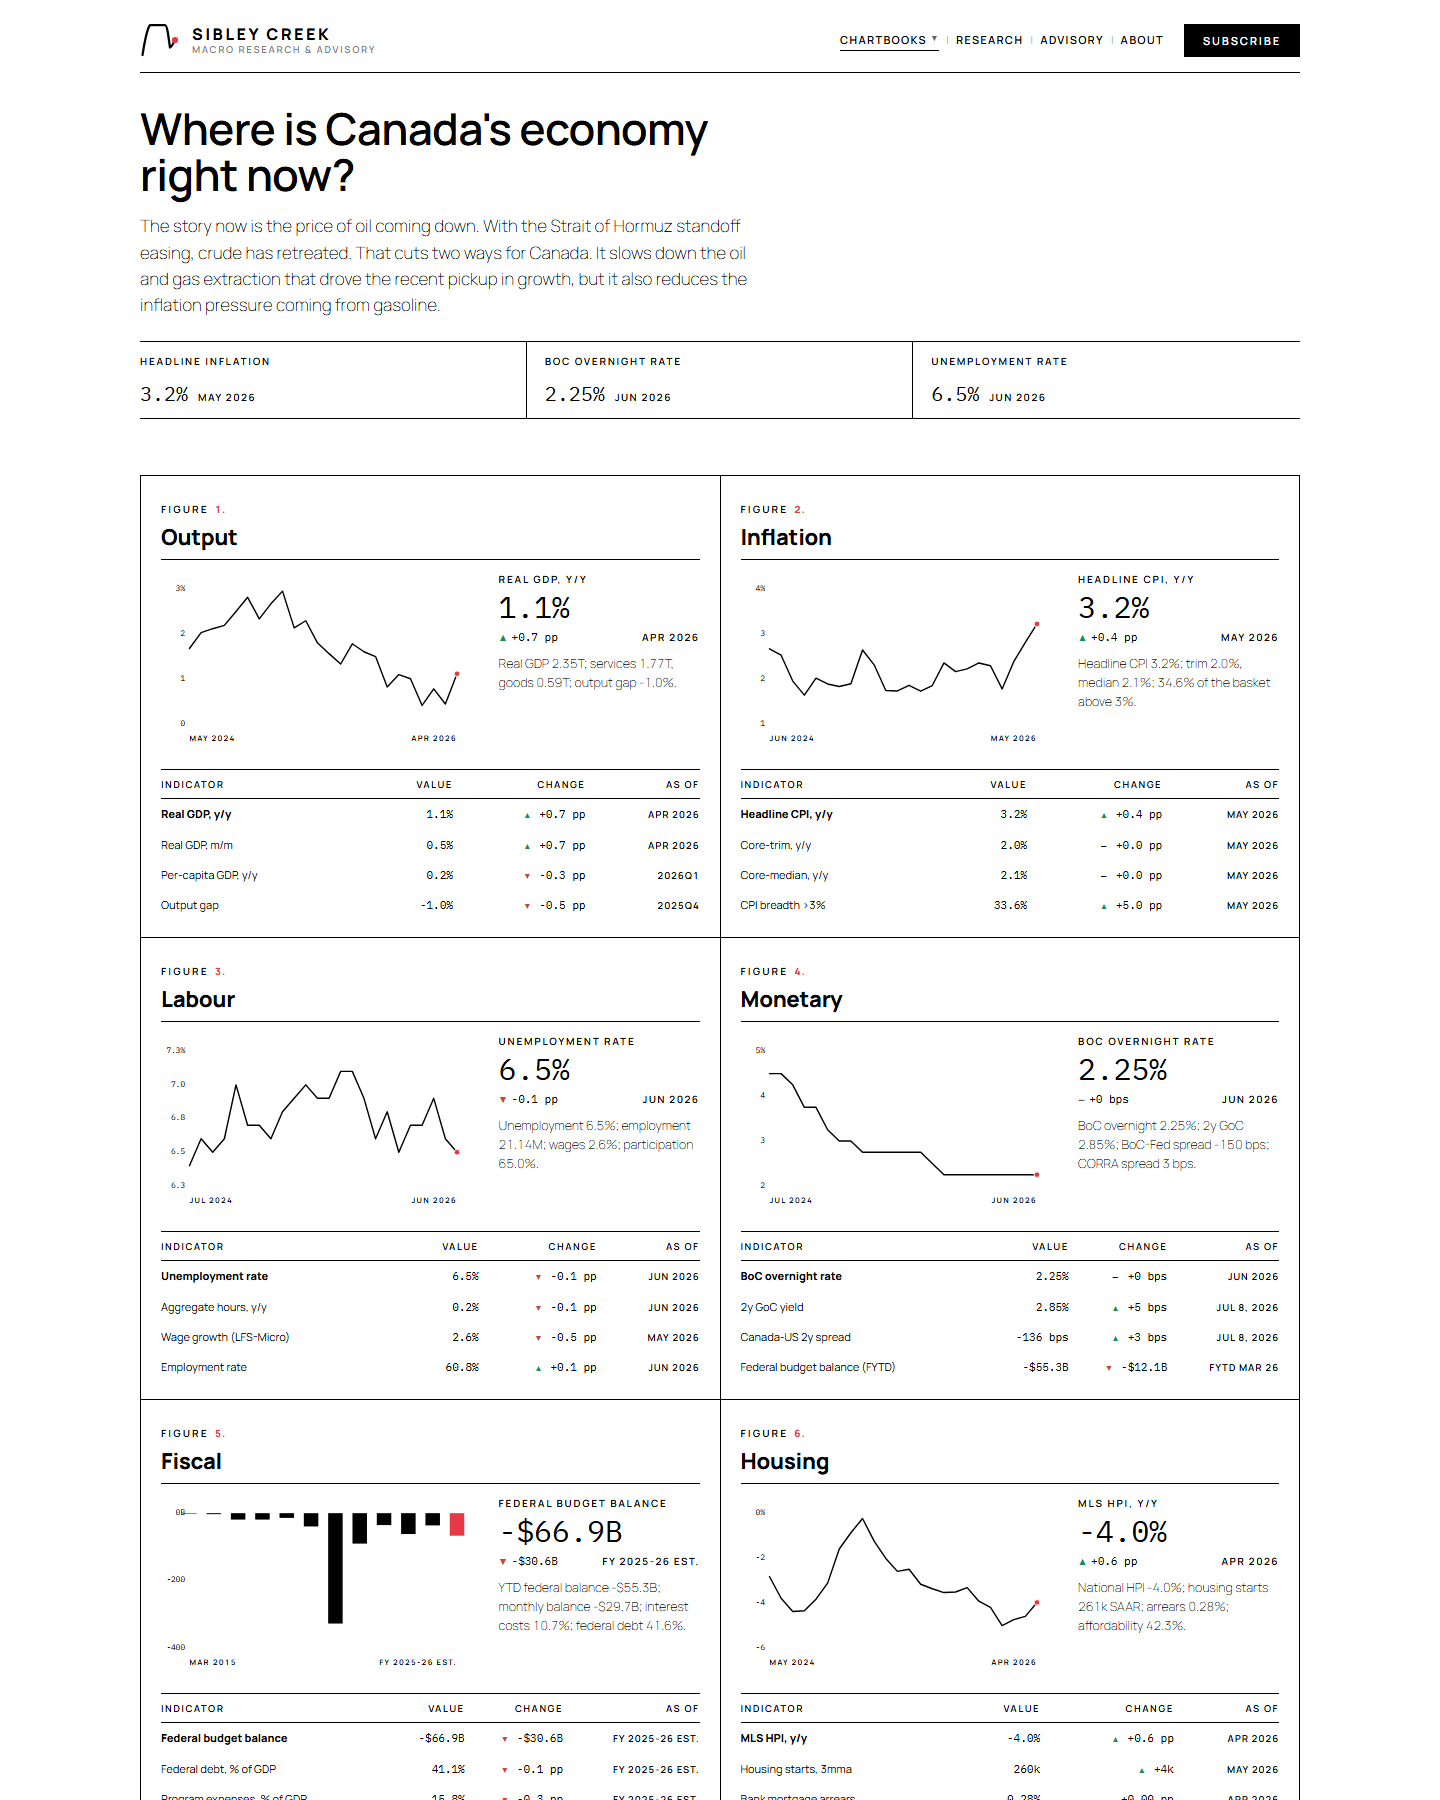
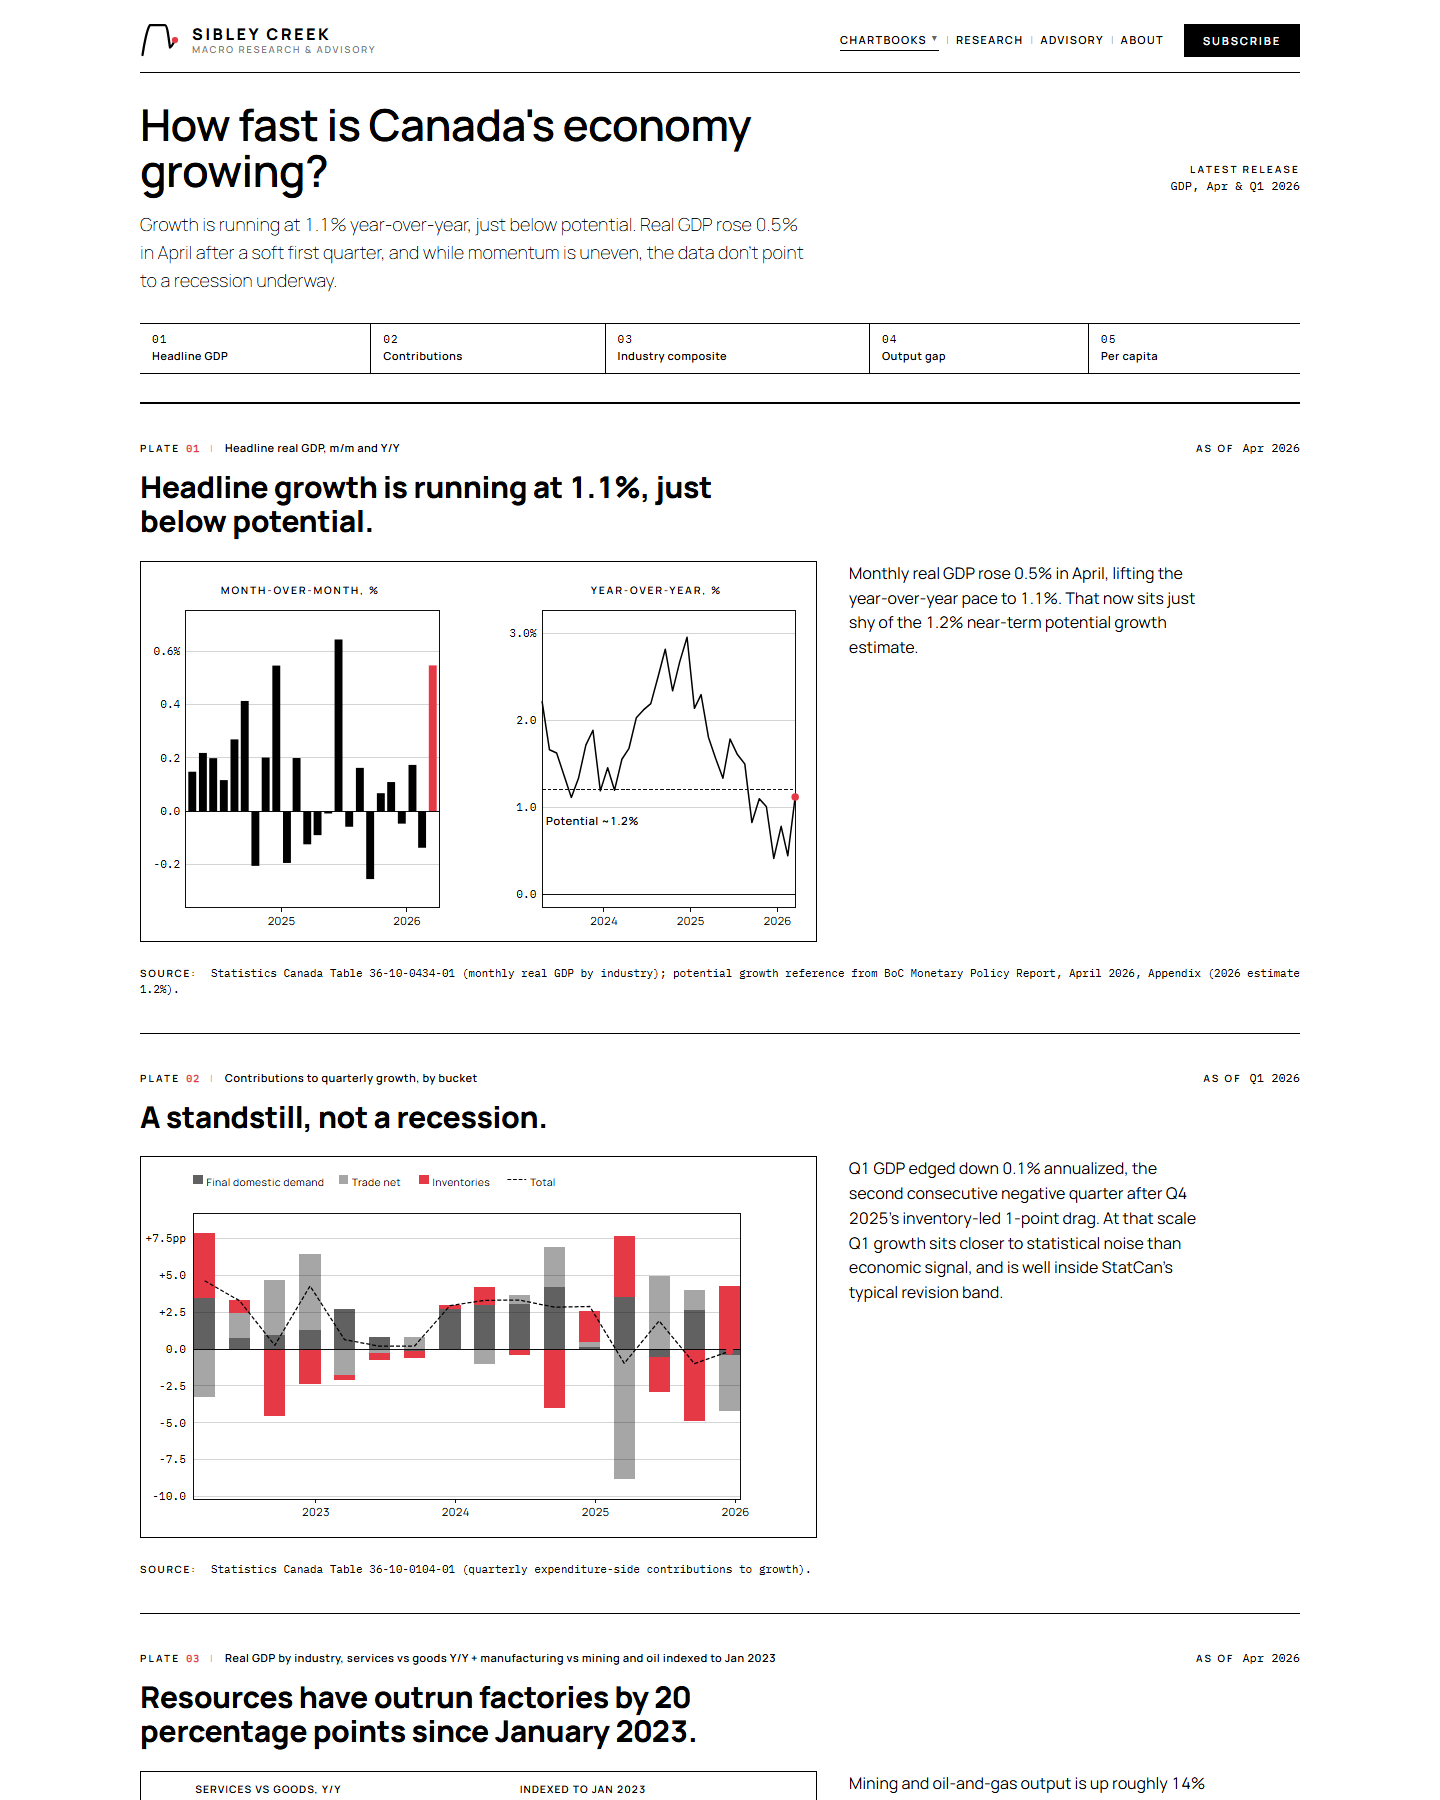
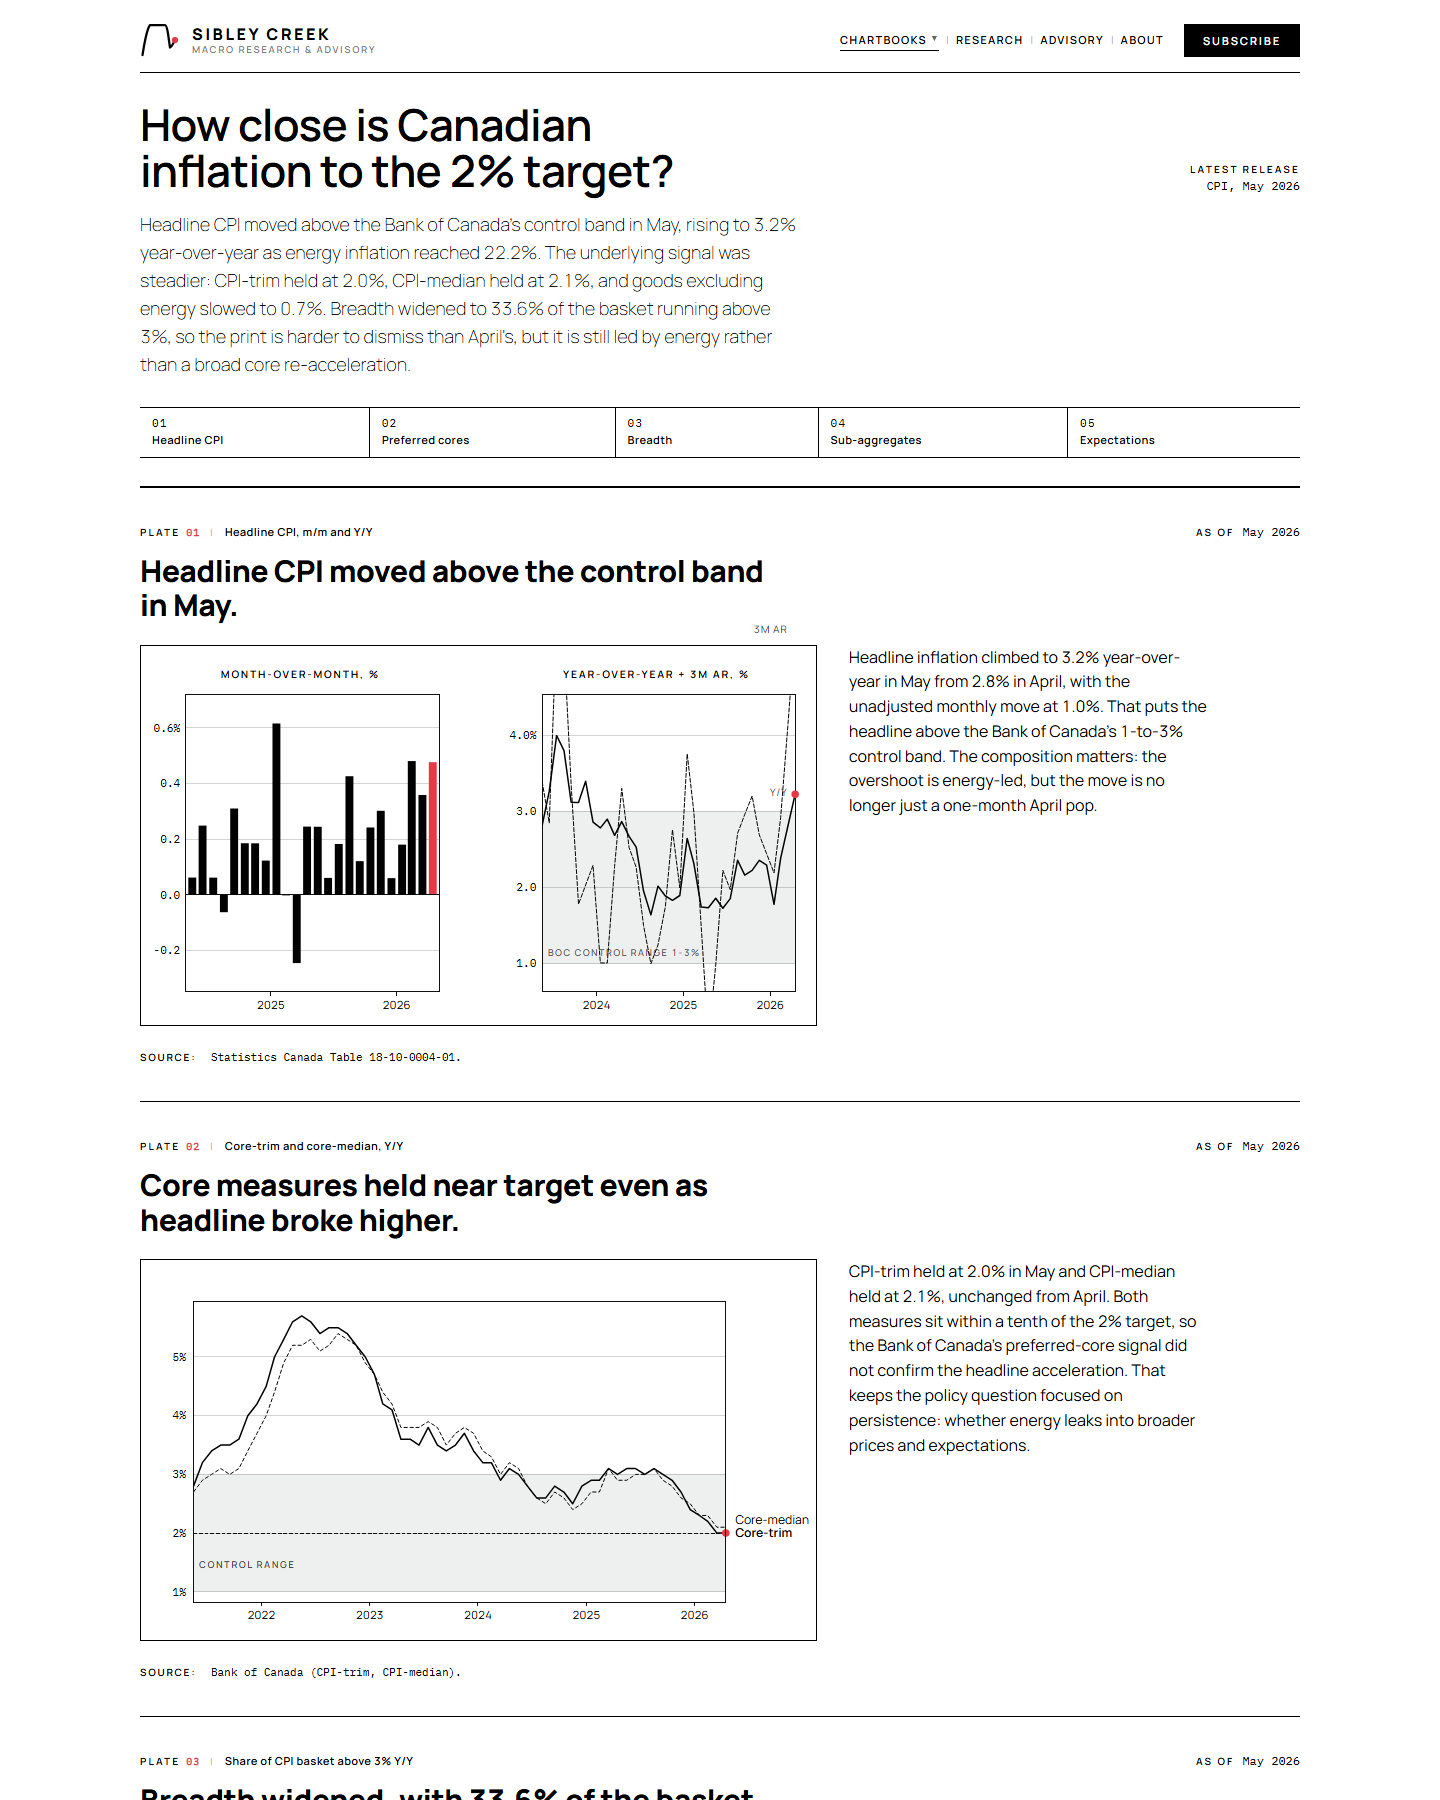
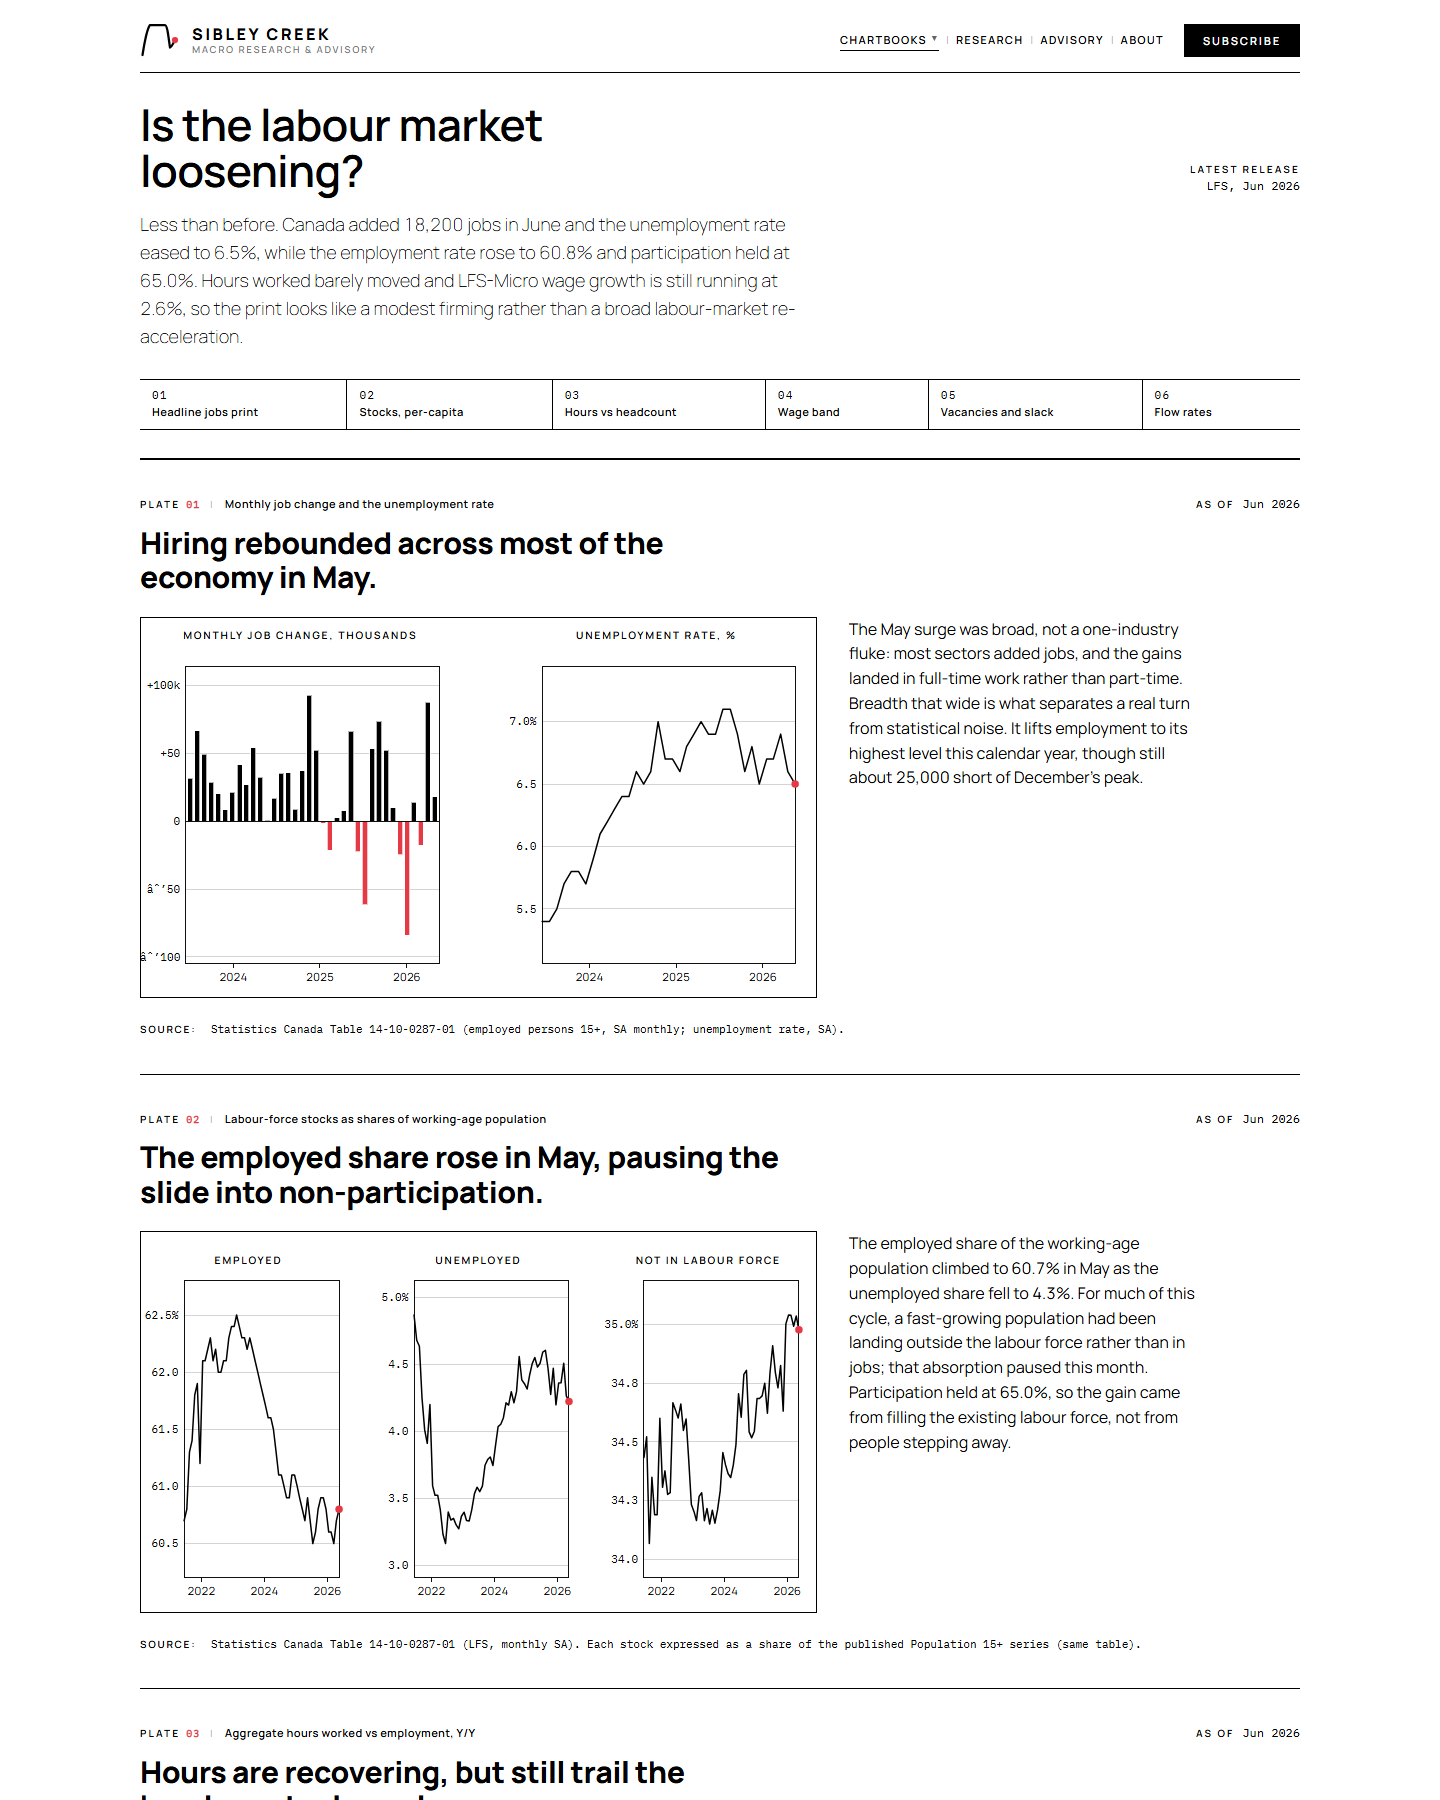
Chartbooks
A chartbook for every section.
Each of those eight sections gets its own chartbook of five to six plates, threaded with a written argument.
Built from primary sources. The charts are the analysis.
Browse the chartbooks →Data commentary
Same-day analysis of every major Canadian print.
Every major Canadian print — CPI, jobs, BoC decisions, trade, monthly GDP — gets a short note within hours: the take, the chart, and a forward look at next month's watch-item.
Distributed as PDFs to subscribers. Visible here as they ship.
Read our commentary →
Advisory
Work with Sibley Creek.
We extend in-house economics teams that are swamped, and provide specialized Canadian-macro depth that generalist desks can't always cover. On retainer, on project, or for one-off briefings.
Typical clients: hedge funds, asset managers, family offices, trade associations, exporters, government relations firms, Crown corporations.
Hire us →Subscribe
Get our research in your inbox.
Commentary the day a print lands. Chartbooks as they ship.
- · No spam. Cancel any time.
- · Free during founding-subscriber phase.
- · First access to the paid tier when it launches.